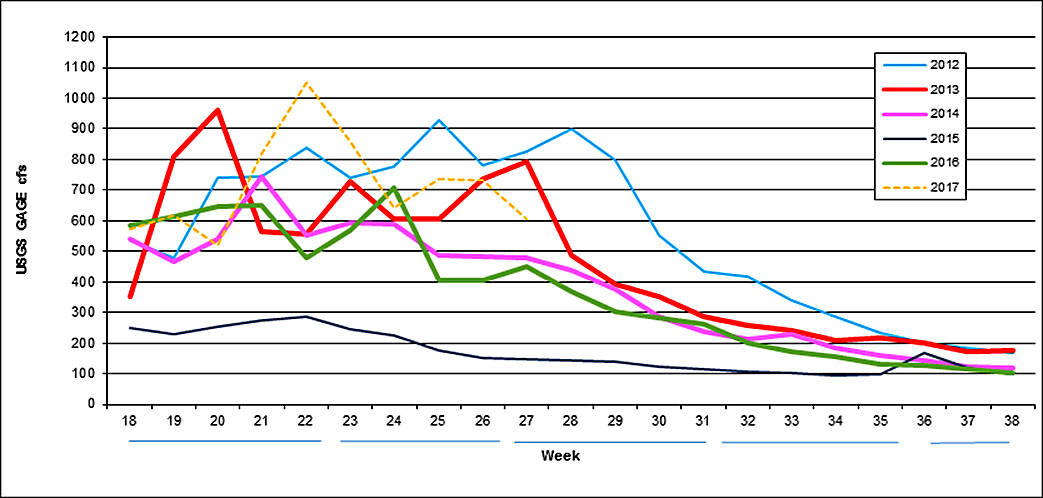
The Dungeness River is past its peak, according to a graph of its flow for the year. A hydrograph is an expression of water volume in a stream, lake or aquifer over time. For a river, it would be flow rate or stream height (called “stage”) plotted against either calendar year or “water year” (Oct. 1-Sept. 30).
What’s cool about a hydrograph is that it’s like a signature — unique to each individual stream, lake, well or other water body. Each graph expresses the immediate weather and climate conditions for a particular spot in a watershed, as well as the cumulative effects over a period of time. For example, a record-low water level in a well is a symptom of either long-term drought or higher-than-normal pumping.
If you plot the average stream flow at a certain location on a given day for many years, then you’ve got the stream’s long-term signature.
Compare the hydrographs of average flows from one decade to the next to distinguish potential trends or the plots from year to year such as the illustration above for the Dungeness River. Farmers, fishermen, irrigators and researchers routinely “read” the signatures of rivers to gain insights into current (no pun intended) conditions.
As you can see, a hydrograph conveys a wealth of information and illustrates the importance of continuous monitoring. The Dungeness River, one of the most studied in the state, has had flow measured since 1923 — now electronically transmitted real-time by USGS at River Mile 11.2 and by Washington Department of Ecology near the mouth.
Winter storms, of course, generate the highest flows in the Dungeness, with “flood stage” defined at 7 feet (*around 6,000 cubic feet, or 45,000 gallons, per second) when raging flows that tear at the streambanks and anything built on them. But because storms rarely happen on the exact same date, the long-term average daily flows in winter fluctuate (spikes being the largest storms) and are not the highest of the year.
That honor usually has rested with the consistently rising and falling average daily flows during snowmelt season. Right now we’re on the downward slope of the Dungeness River hydrograph’s early summer “bell curve.” Exactly when the hydrograph peaks, how fast the flow is and how long it lasts depends on how high the temperature gets in the mountains and the amount and density of snow available.
‘Snow-dominant’ system
The Dungeness is considered a “snow-dominant” system because the snowmelt bell-shaped curve dominates the hydrograph. Watersheds without snowpack accumulating in the high elevations don’t have that “freshet” of high stream flows each spring and are so-called “rain-dominant.”
Once the snow is gone, the Dungeness River is sustained by baseflow, the water seeping into the stream channel from the ground. On a hydrograph this is the flattest part of the curve, starting anywhere from July to September.
The baseflow in some streams, like the Methow River in eastern Washington, another highly studied watershed where I happen to be visiting last weekend, disappears and reappears from reach to reach.
To the casual observer the flow is “lost” from late summer through winter (Lost is the name of one of the Methow’s tributaries), but it is actually moving along just fine within deep glacial outwash gravels, emerging again when the gravel is less deep or less porous. The river actually flows underground. In this case the hydrograph flattens out to zero!
At the time I checked on July 9, the water level (stage) in the Dungeness is at 3.75 feet (535 cubic feet per second, cfs), spot on the long-term average for this date. During the 2015 snowpack drought it was 2.6 feet (145) cfs on this date and continued to drop to a low of 2.35 feet (82 cfs) before a rainstorm came at the end of August.
Barring a long heat wave, our snowpack should last through July, at least. However, the Dungeness is one of several rivers expected to transition from snow-dominant to rain-dominant within 2-4 decades due to global warming.
How much stream flow is enough for farmers? How much is enough for salmon? That’s a big question and must wait for another day.
Geek Moment
For the 2017 water year on July 6 (starting last Oct. 1):
• In Sequim, cumulative rainfall = 14.8 inches (somewhat high)
• Dungeness River at Mile 11.8, flow = 535 cfs (median level for early July). Peak flow snowmelt flow was 1,340 in early June. Typical baseflow is 160-180 cfs in September
• Bell Creek flow into Carrie Blake Park = dry; at the mouth = about 1 cfs. (1 cfs is just under 650,000 gallons per day)
Ann Soule is a hydrogeologist immersed in the Dungeness watershed since 1990, now resource manager for City of Sequim. Reach Ann at columnists@sequimgazette.com or via her blog at watercolumnsite.wordpress.com.